
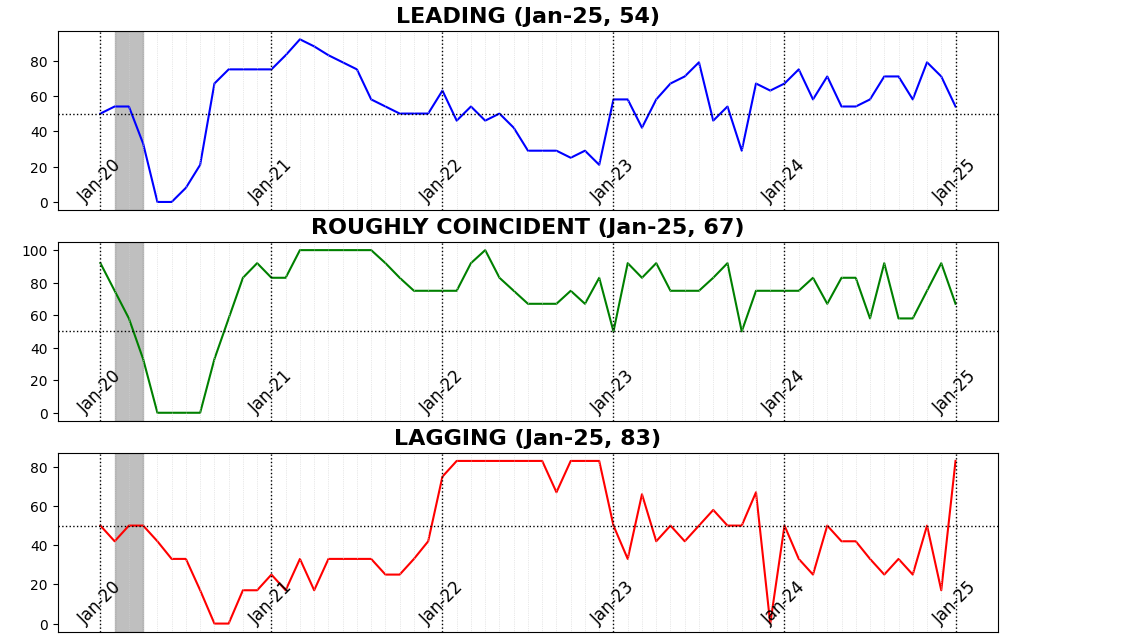
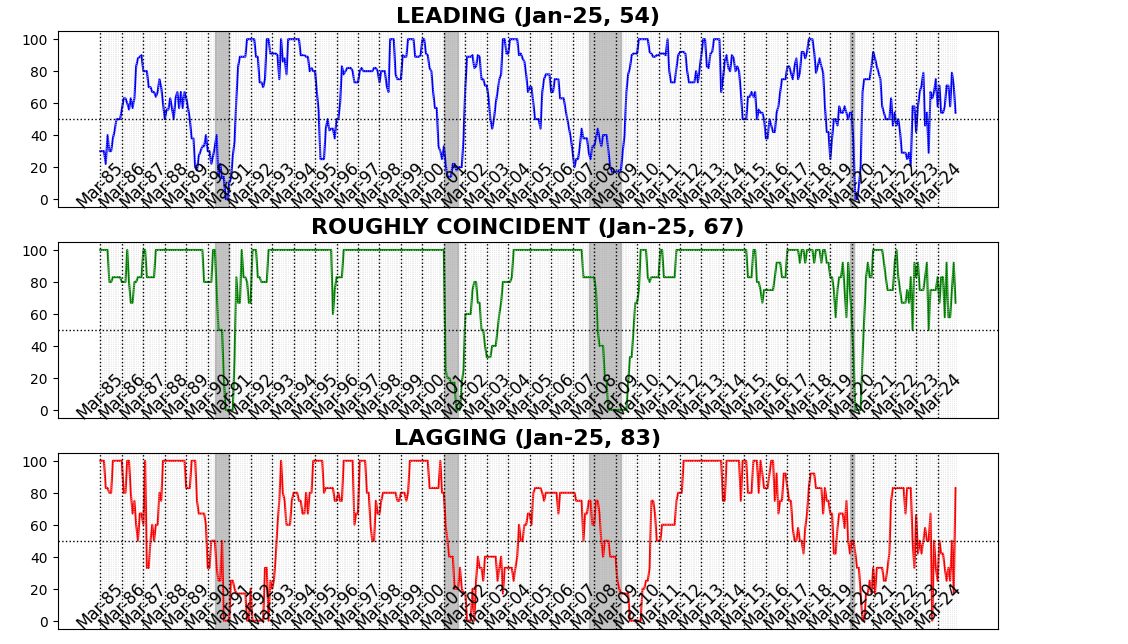
In January 2025, the AIER Business Conditions Monthly indicators showed moderate economic momentum, with leading indicators moderating, coincident measures remaining solid, and lagging indicators rebounding sharply. The Leading Indicator declined to 54, down from 71 in December, reflecting softening forward-looking economic activity. However, the Roughly Coincident Indicator held firm at 67, indicating steady real-time economic conditions, while the Lagging Indicator surged to 83, suggesting improving conditions in longer-cycle economic trends. The divergence between leading and lagging measures indicates short-term uncertainty, though the broader economy shows resilience for now.
Leading Indicator (54)
Of the twelve Leading Indicator components, six rose, one was unchanged, and five declined in January.
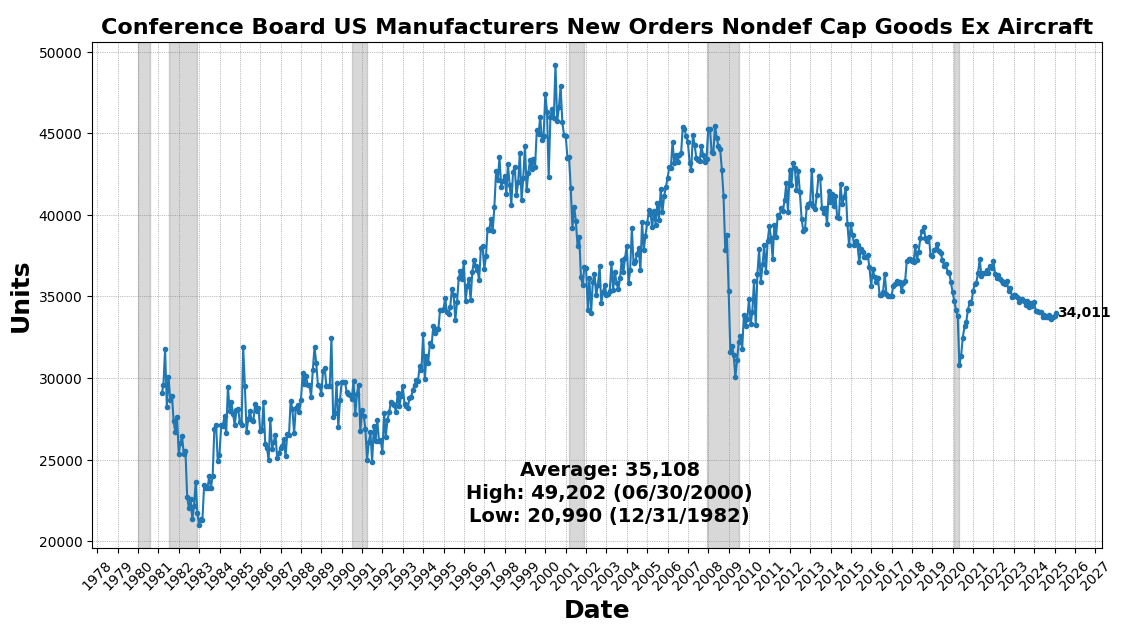
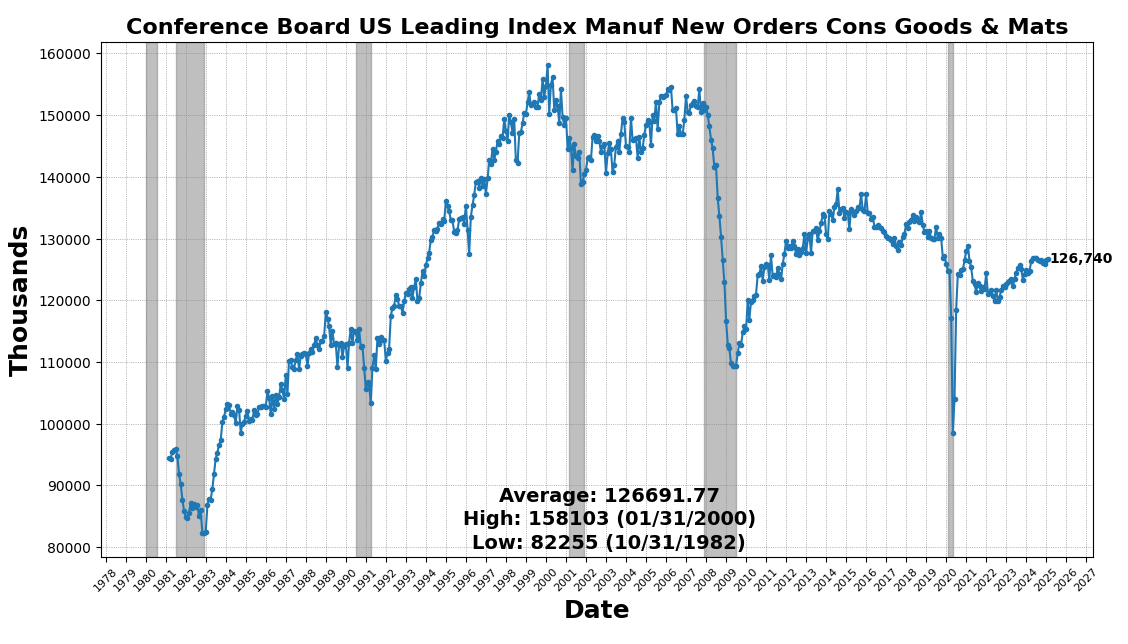
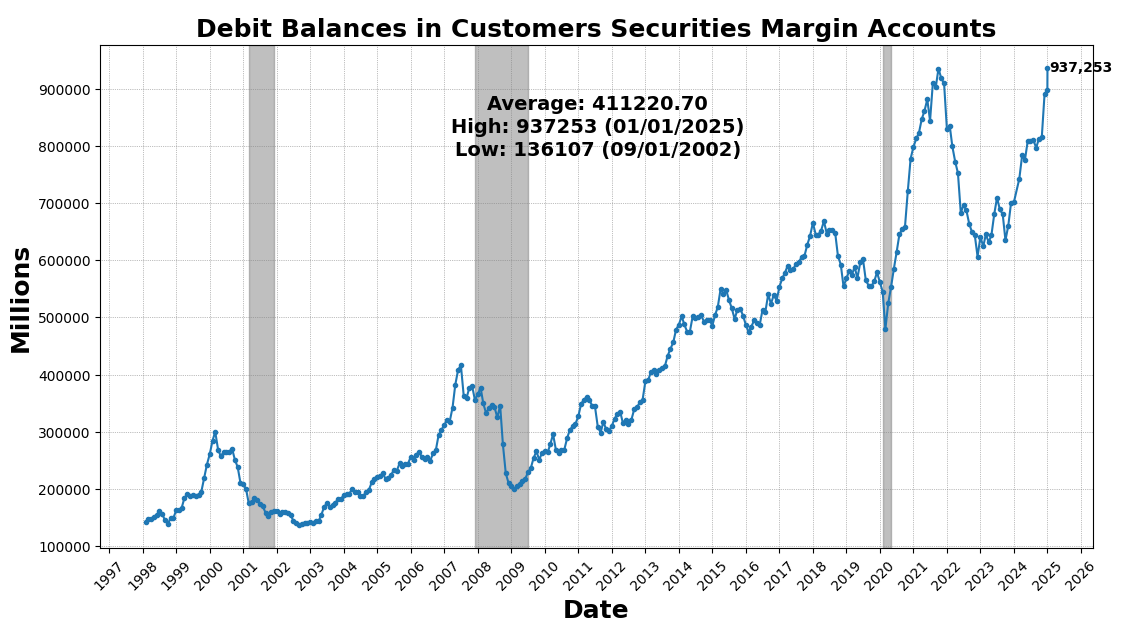
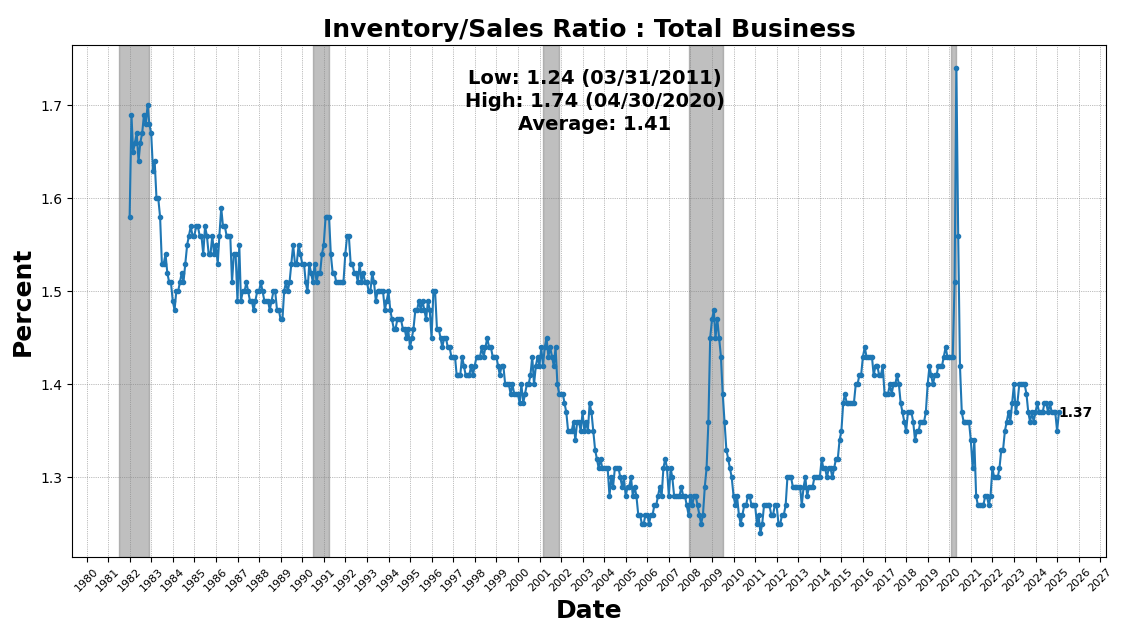
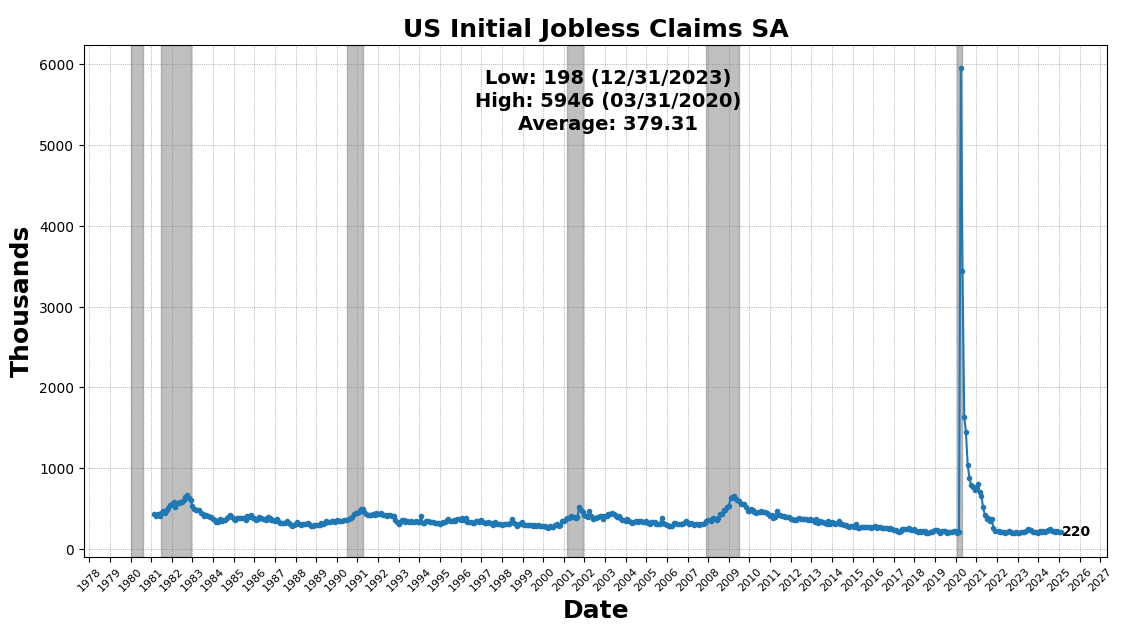
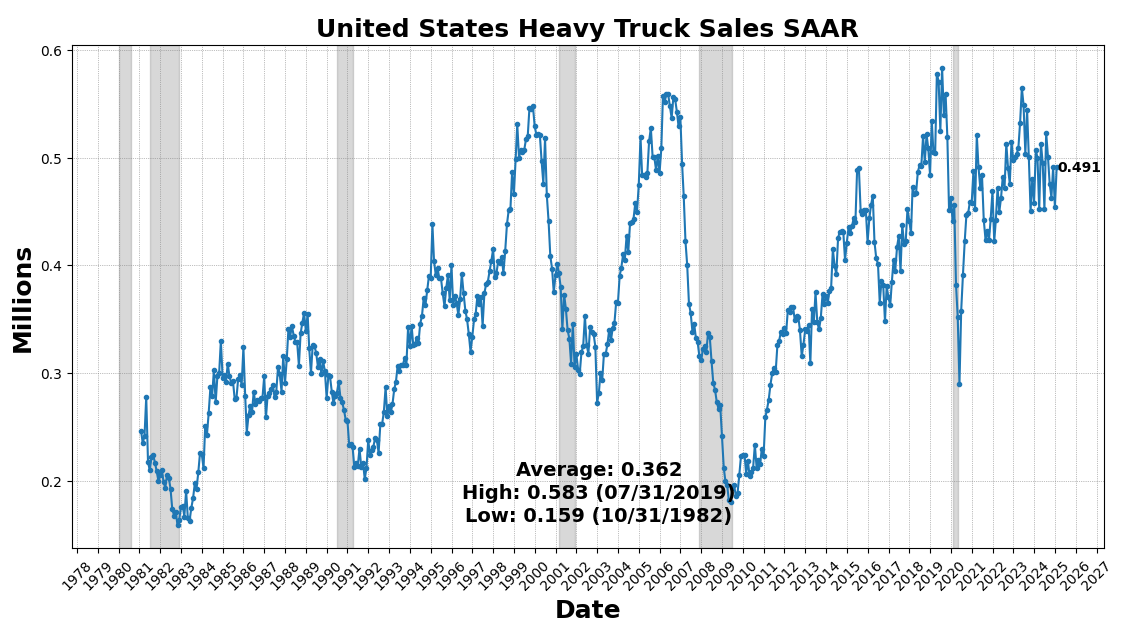
The largest increase came from United States Heavy Trucks Sales SAAR, which rose 8.2 percent, reflecting continued demand for durable goods and business investment in transportation equipment. However, some of this surge may be attributed to forward ordering as firms seek to preempt potential cost increases from upcoming tariffs. US Initial Jobless Claims SA (4.3 percent) and FINRA Customer Debit Balances in Margin Accounts (4.2 percent) also increased, indicating a still-resilient labor market and continued risk appetite in equity markets. Manufacturing new orders saw modest gains, with the Conference Board’s Manufacturing New Orders for Nondefense Capital Goods (ex-Aircraft) up 0.6 percent and the Manufacturing New Orders Consumer Goods & Materials Index up 0.12 percent, suggesting marginal strength in production demand. The Inventory/Sales Ratio rose slightly (0.01 percent), pointing to flat inventory management trends.
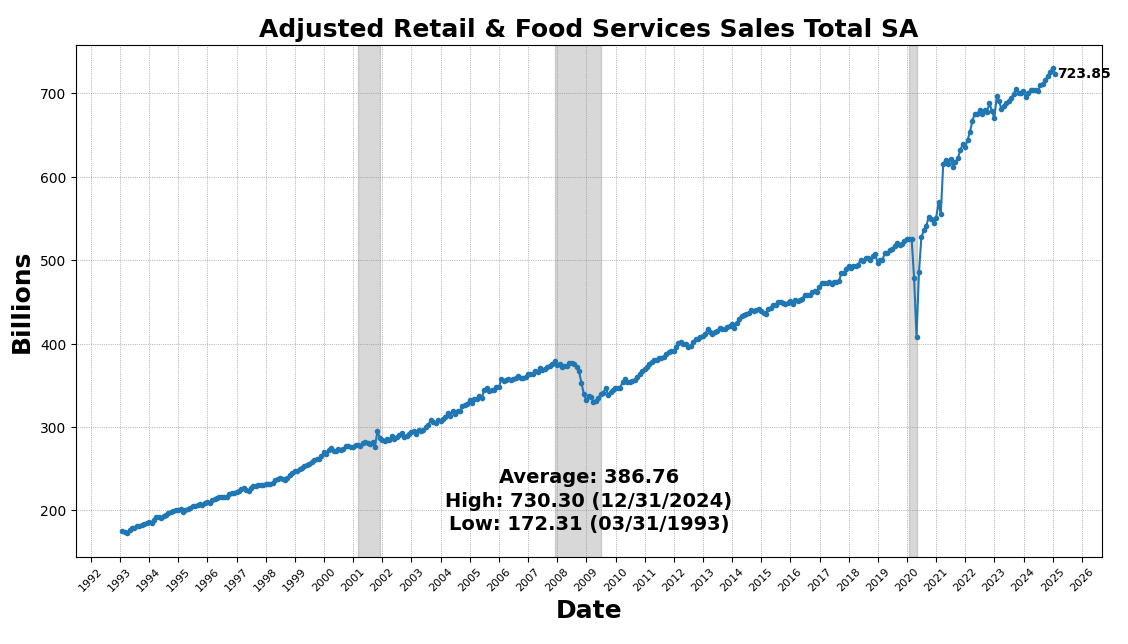
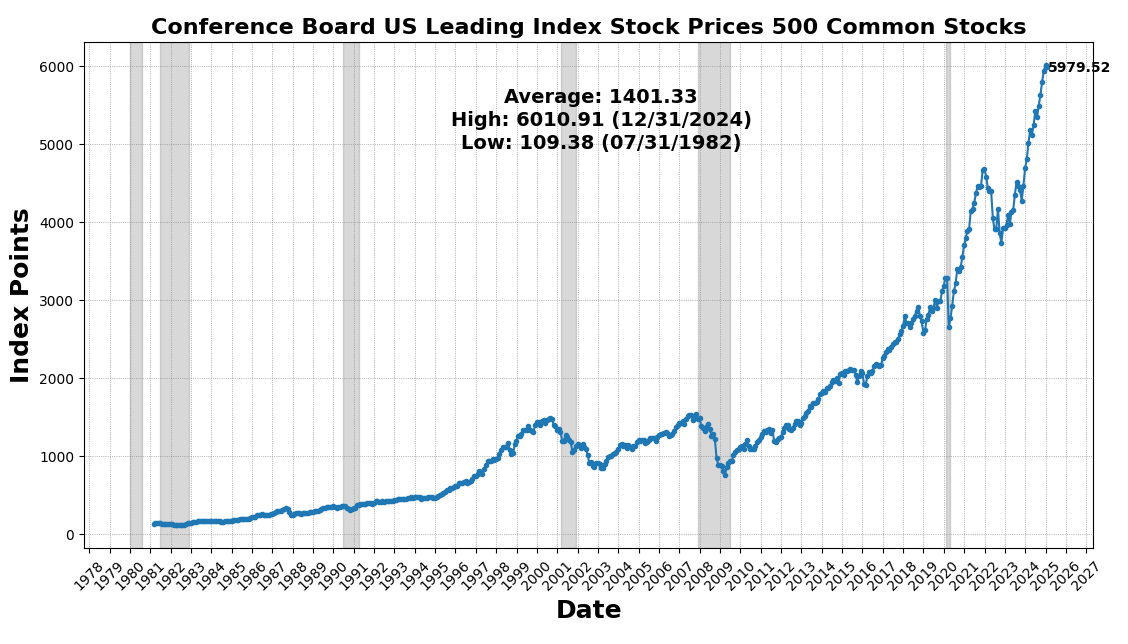
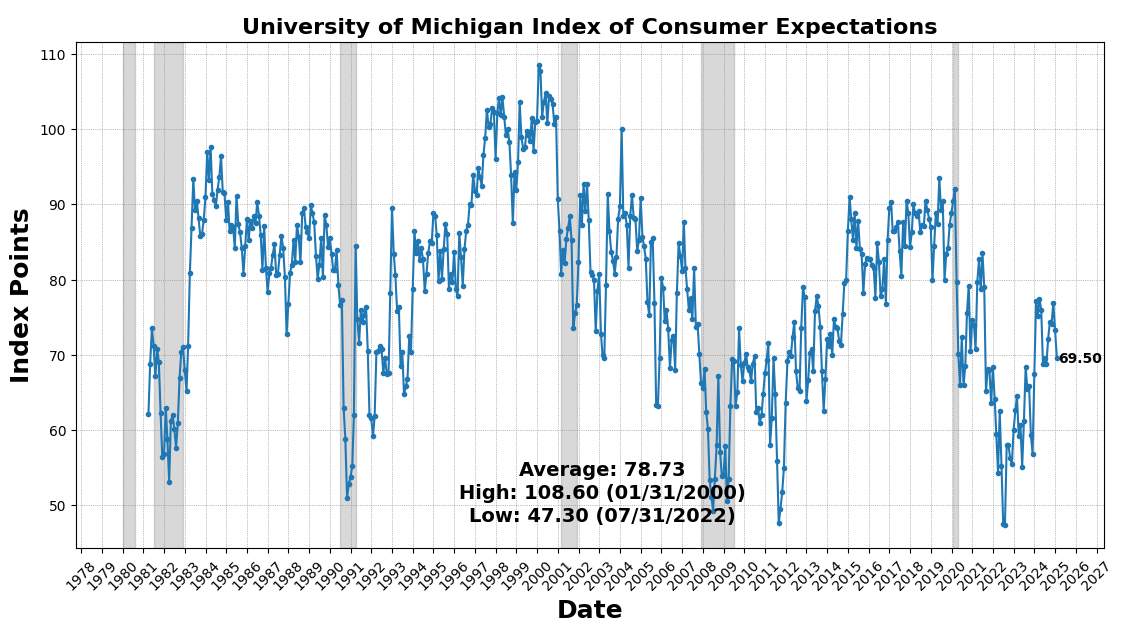
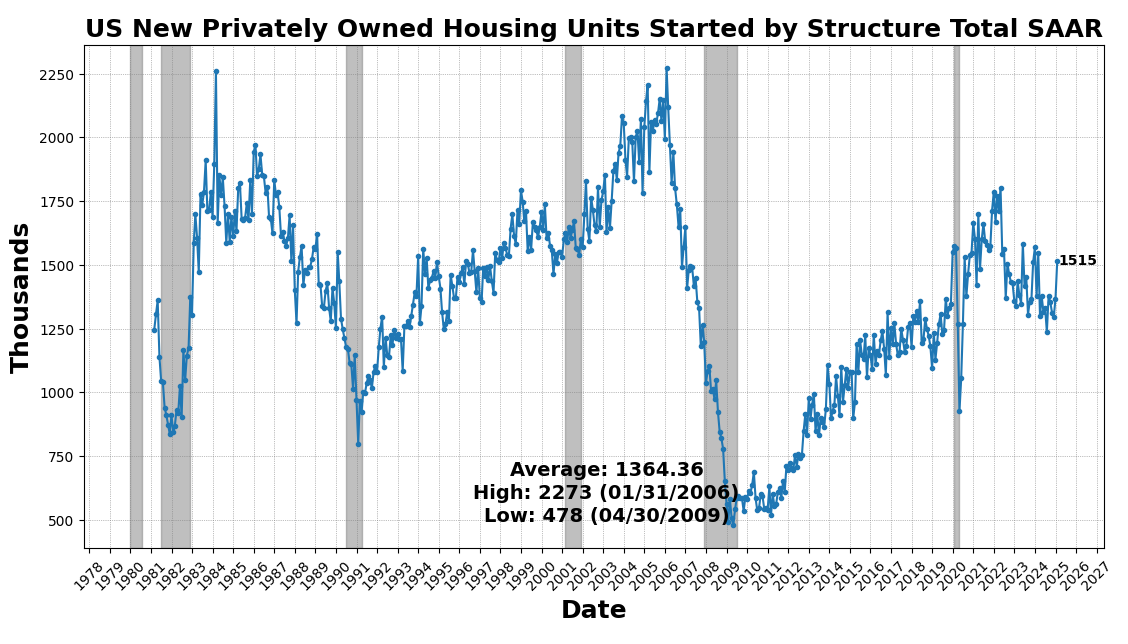
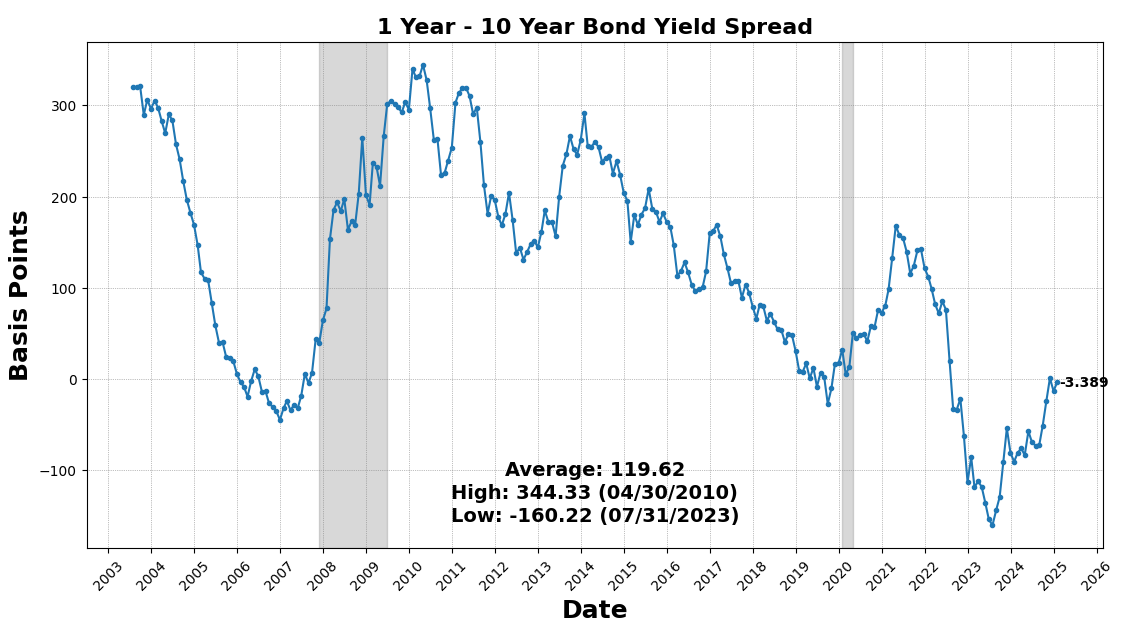
On the downside, housing activity remained weak, as US New Privately Owned Housing Units Started fell 9.9 percent, marking a continued slowdown in residential construction. The 1-to-10 Year US Treasury spread declined 8.3 percent, maintaining its deep inversion, historically a strong recession signal. Consumer sentiment weakened, with the University of Michigan Consumer Expectations Index down 5.3 percent, and Adjusted Retail & Food Services Sales Total SA down 0.9 percent, signaling softening consumer demand. Finally, the Conference Board’s Leading Index of Stock Prices fell 0.6 percent, reflecting equity market volatility and investor caution.
Roughly Coincident Indicator (67)
Four constituents of the Roughly Coincident Indicator rose and two declined.
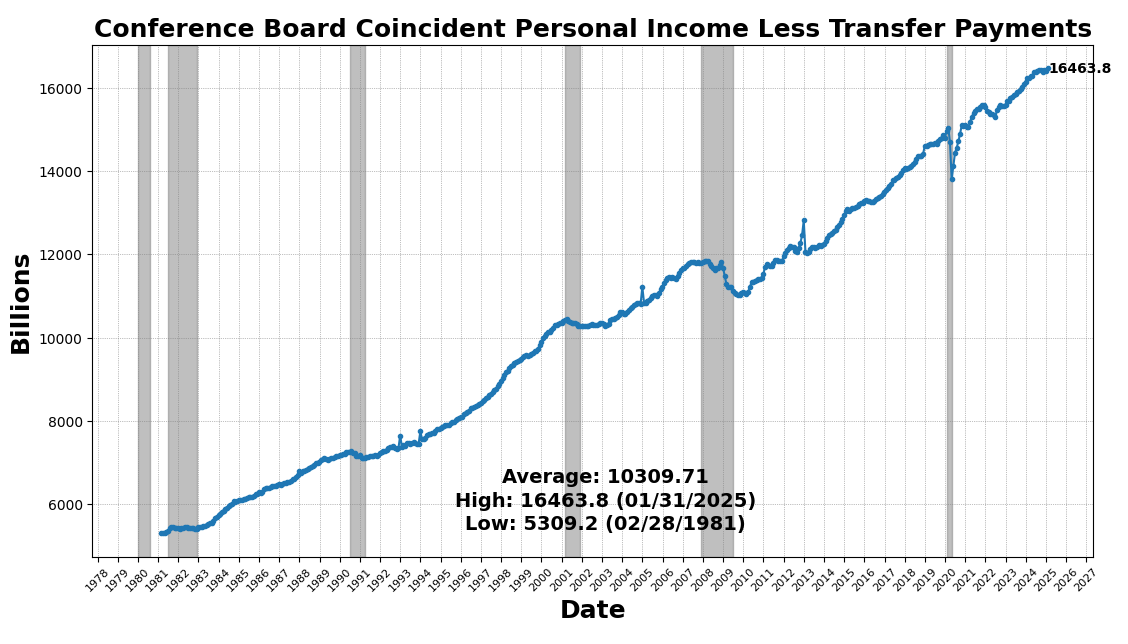
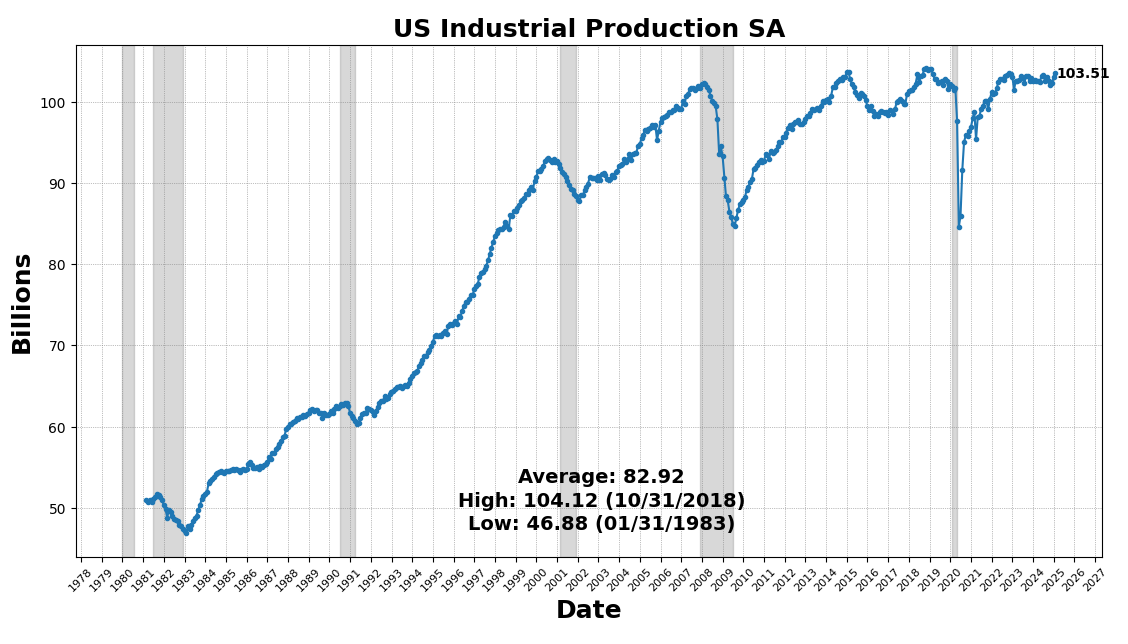
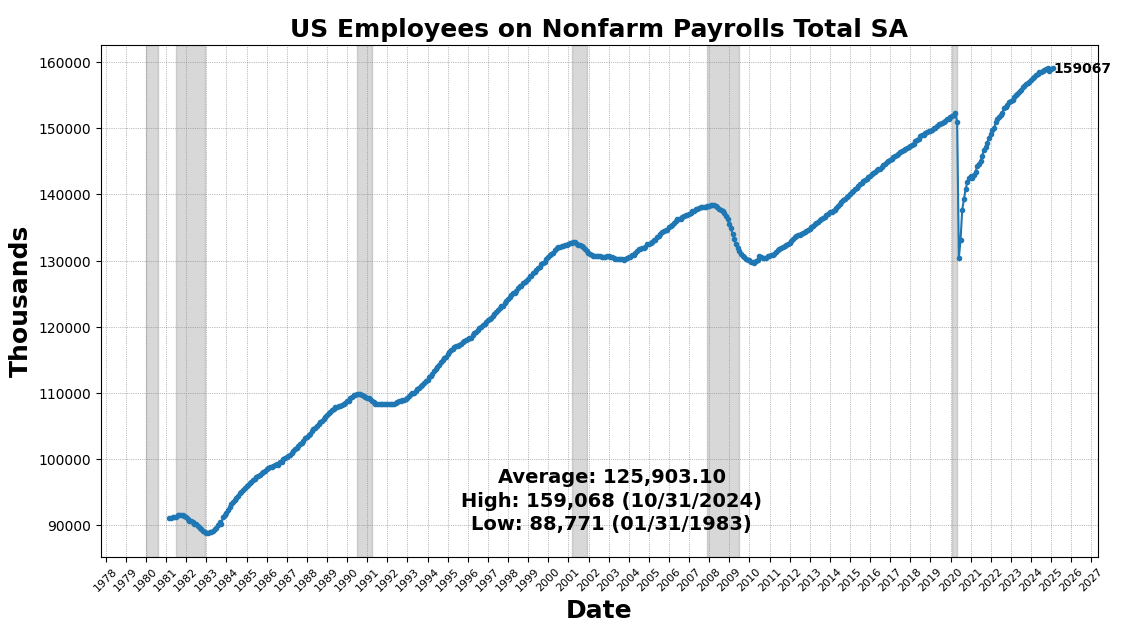
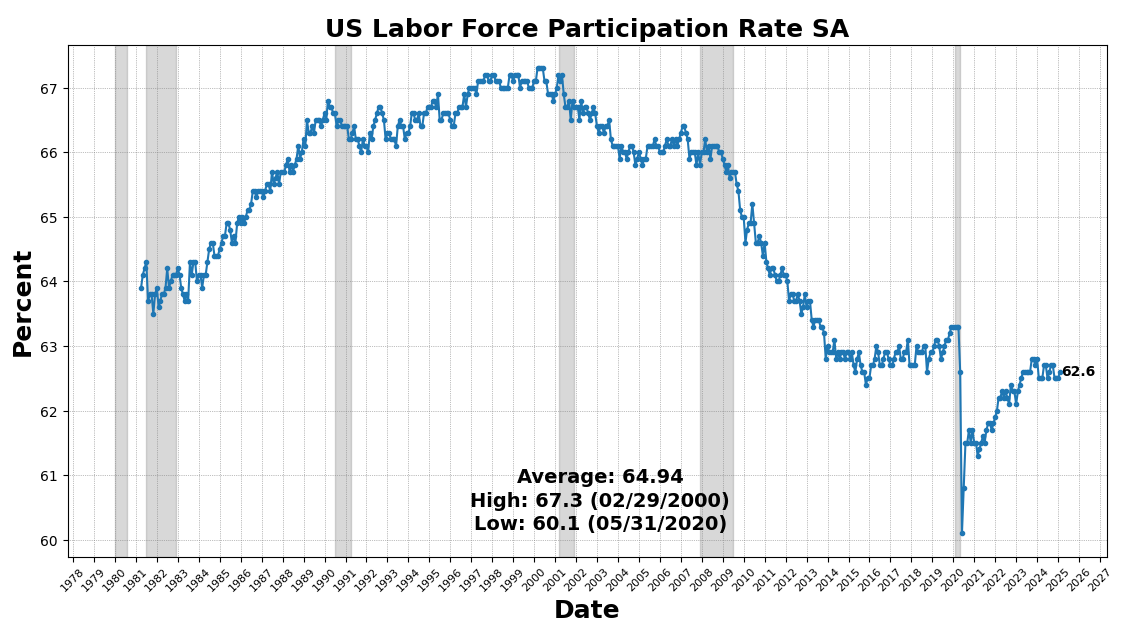
The strongest increase came from US Industrial Production SA (0.5 percent). Conference Board Coincident Personal Income Less Transfer Payments rose 0.4 percent, indicating moderate income growth outside of government support. Labor market participation improved, with the US Labor Force Participation Rate up 0.2 percent and Nonfarm Payrolls increasing slightly (0.1 percent). These reflect ongoing, but slowing, job growth in January 2025.
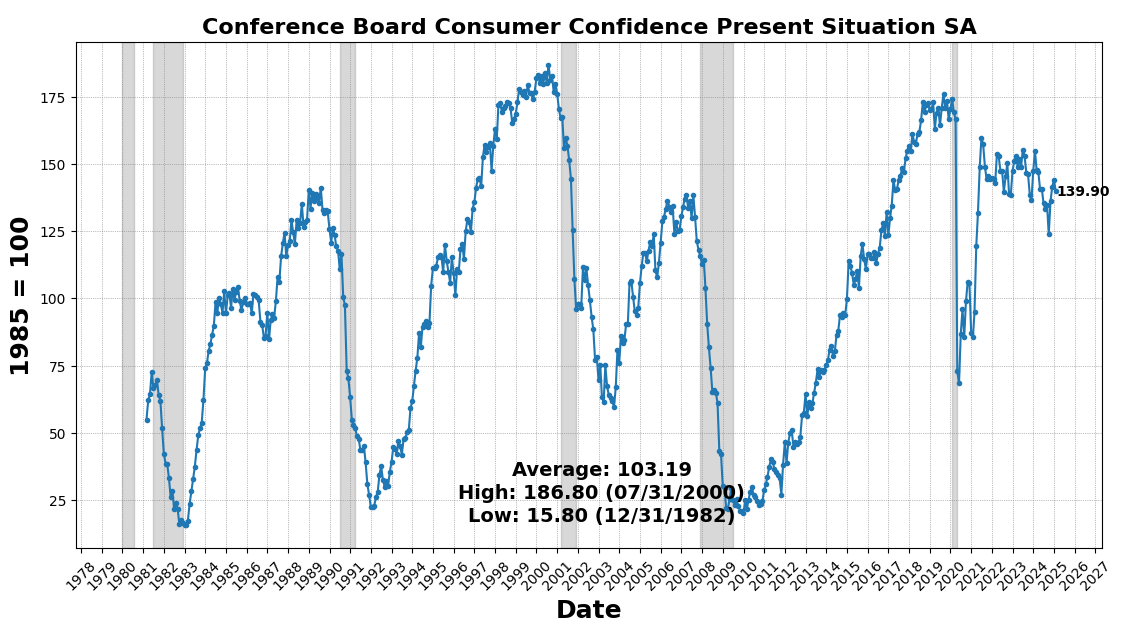
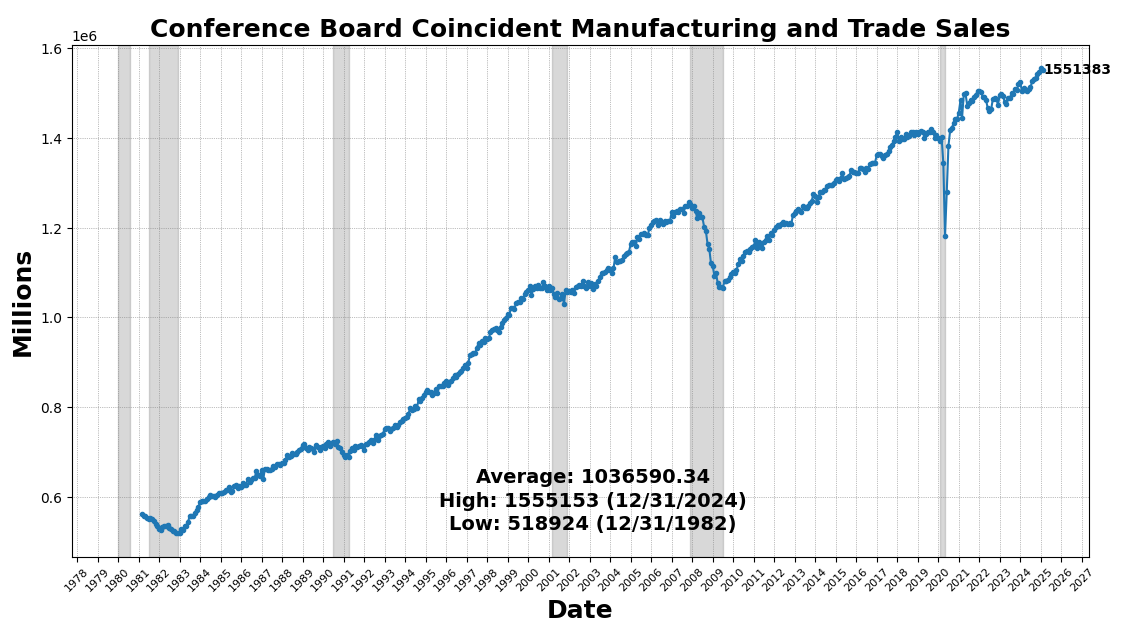
However, consumer sentiment weakened, with the Conference Board’s Consumer Confidence Present Situation Index declining 2.9 percent, reflecting growing uncertainty about near-term economic conditions. Conference Board Coincident Manufacturing and Trade Sales declined slightly (0.2 percent), suggesting a modest pullback in real-time business activity.
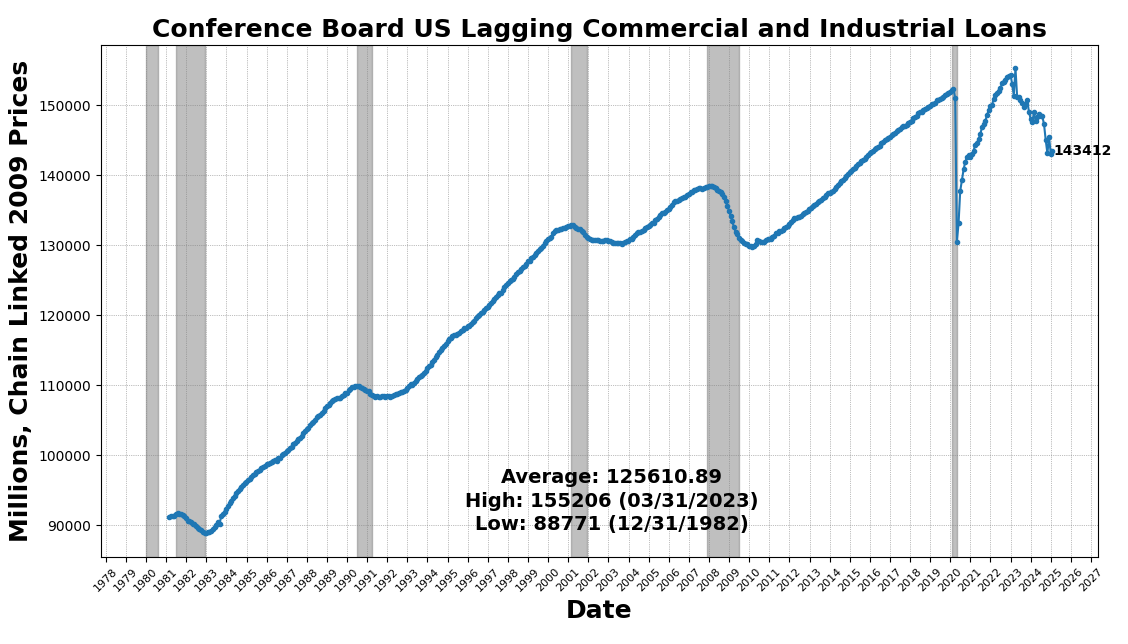
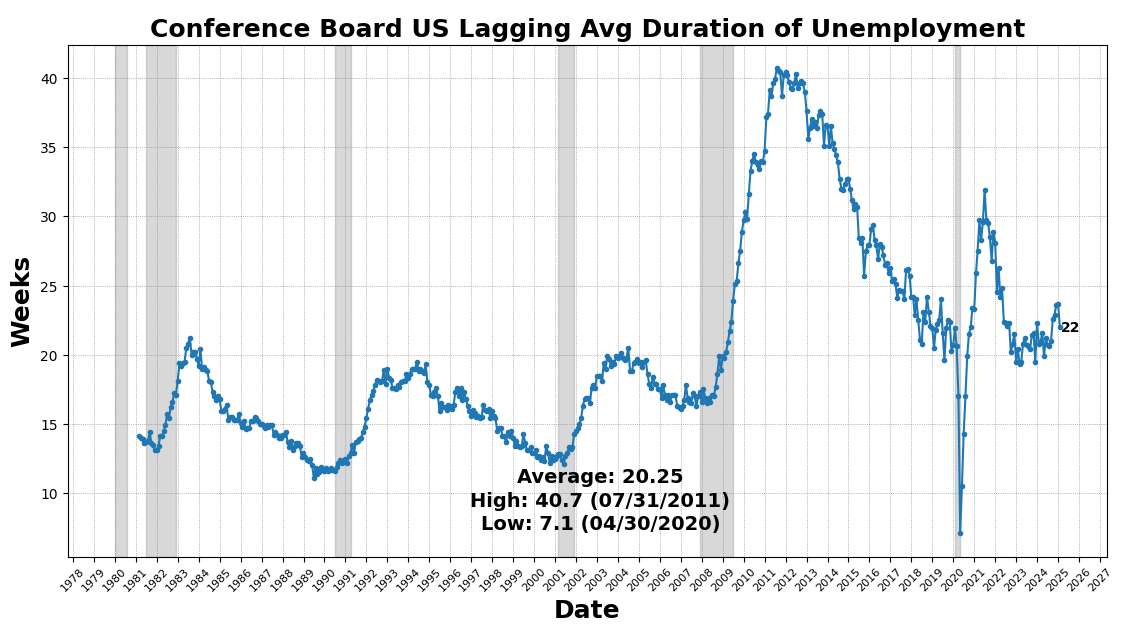
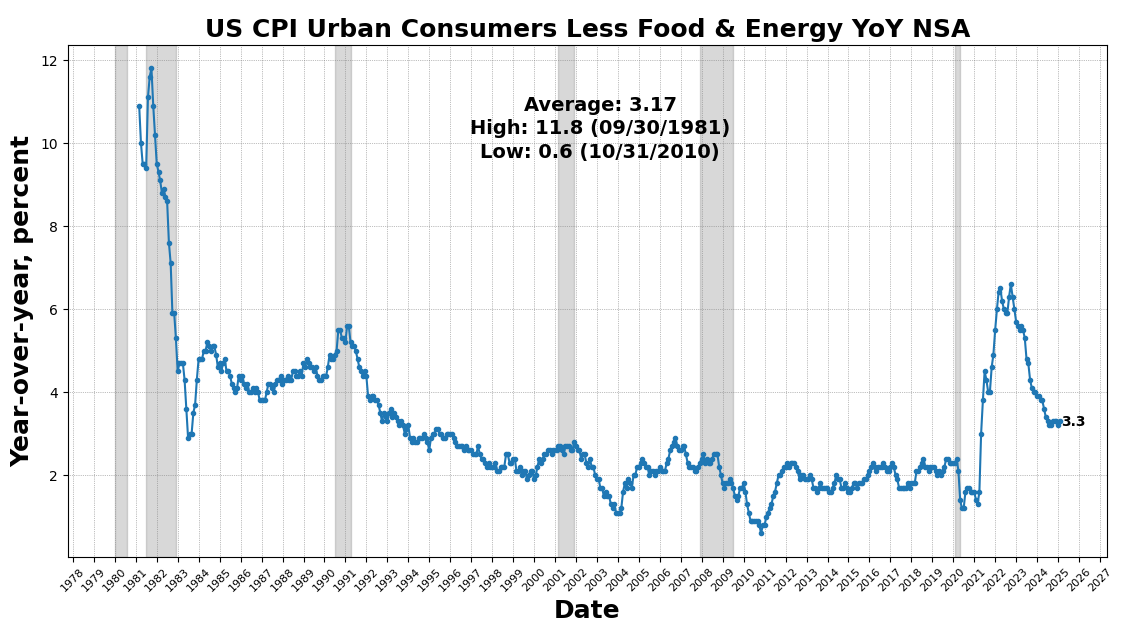
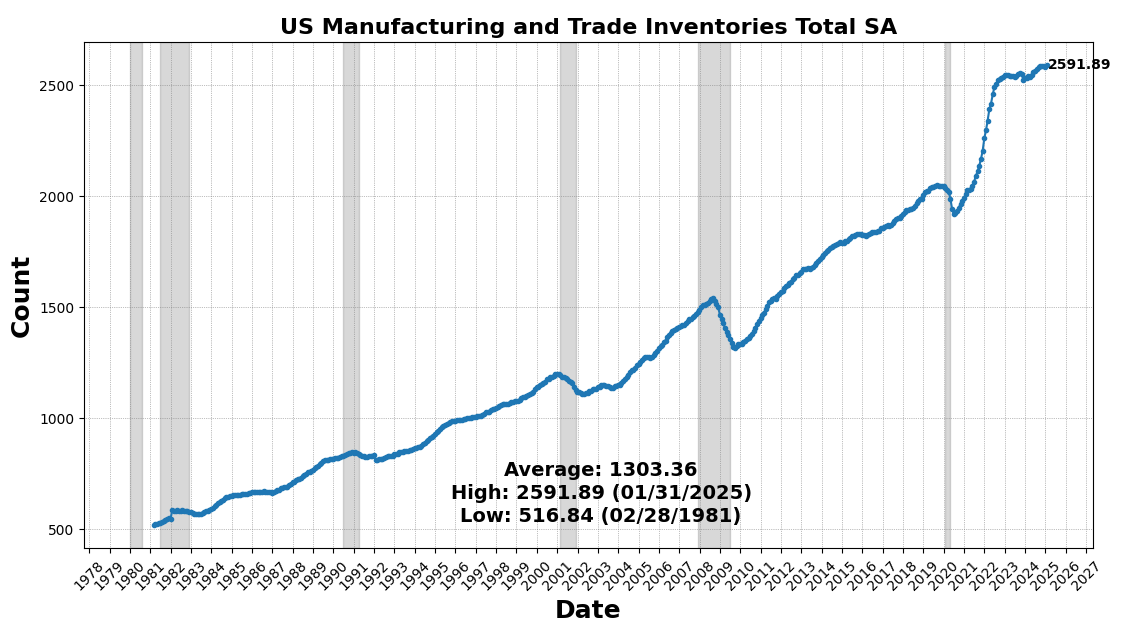
Lagging Indicator (83)
Of the six components, five rose and one was unchanged. At 83, the Lagging Indicator is at its highest level in 25 months (December 2022).
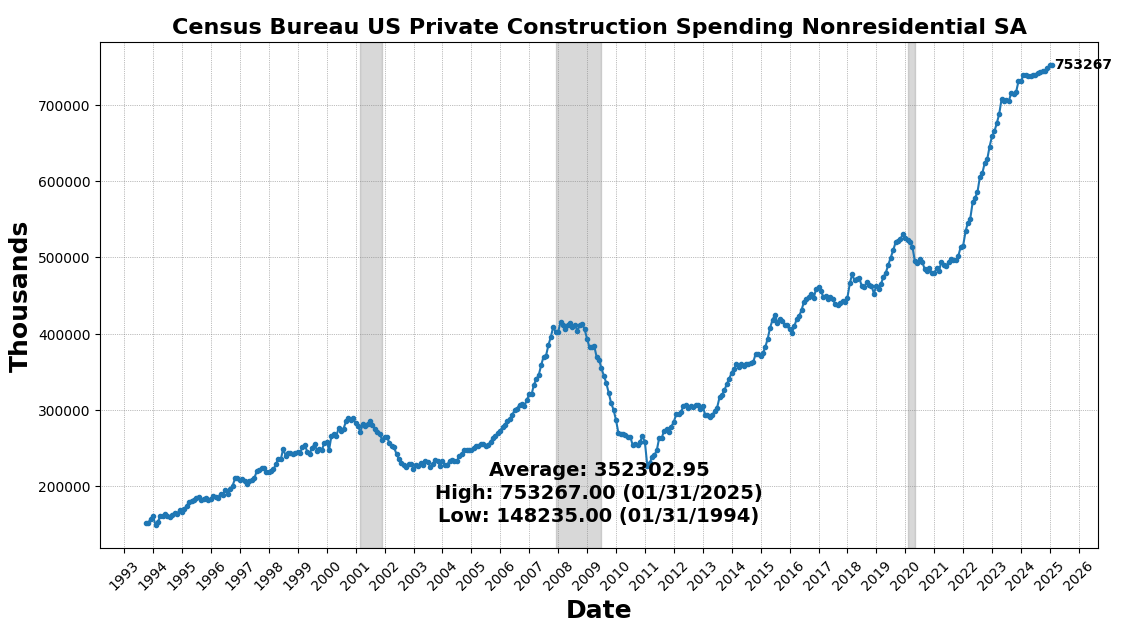
The strongest gain came from US CPI Urban Consumers Less Food & Energy YoY (3.1 percent), reflecting a slowing of the disinflationary trend in core goods and services. Commercial and Industrial Loan activity improved (0.3 percent), and Private Construction Spending saw a marginal gain (0.01 percent), revealing tepidity in long-cycle business investment. US Manufacturing & Trade Inventories ticked up very slightly (0.003 percent), signaling careful, or perhaps hesitant, adjustments to inventory.
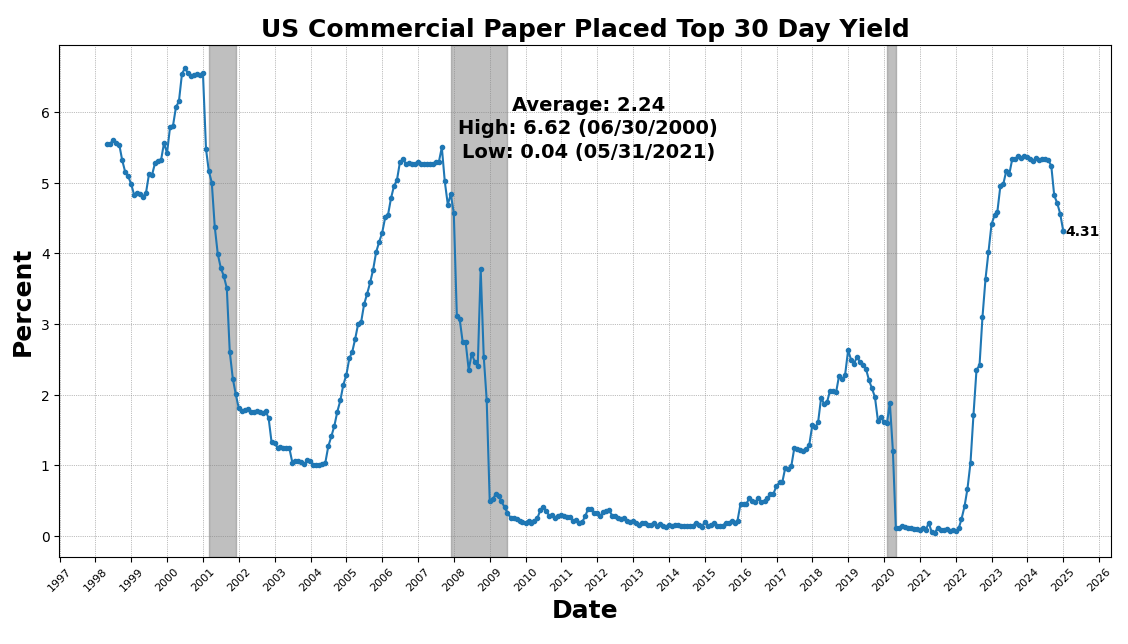
The only unchanged measure was US Commercial Paper Placed Top 30 Day Yield, indicating stable short-term credit conditions. The Conference Board’s Lagging Average Duration of Unemployment fell 7.2 percent, suggesting that unemployed individuals are finding jobs faster, a positive sign for the labor market.
The January 2025 AIER Business Conditions Monthly indicators reflect an economy still expanding but more slowly and with mixed signals. The decline in the Leading Indicator from 71 to 54 was driven by weakening consumer sentiment, slowing retail and food services sales, stagnation in manufacturing activity, and pressure from both a deteriorating housing market and tightening financial conditions.Notwithstanding that the Roughly Coincident Indicator (67) remained solid, and the Lagging Indicator (83) improved notably, indicating strength in slower-moving economic components like inflation, credit, and labor market recovery.
The divergence between leading and lagging indicators makes the rapidly escalating uncertainty in forward-looking economic conditions clear, though real-time and lagging measures suggest areas of ongoing resilience. The dual threat of wild, last-minute policy fluctuations ahead of April 2nd and the long-term consequences of what could be the largest tariff increase since the Smoot-Hawley Act of 1930 are now the primary forces shaping economic activity and financial market behavior.
DISCUSSION
February’s CPI report highlighted the effects of weakening consumer demand for discretionary goods, reinforcing broader signs of softening consumption. While services disinflation continued, goods price declines stalled, particularly in categories sensitive to tariffs including cars, home furnishings, and apparel. The overall impact of President Trump’s trade policies on inflation will depend on whether weaker services spending offsets rising goods prices. For now, the February data suggests that services disinflation outweighed the modest uptick in goods inflation, delaying any significant reacceleration in price growth.
US wholesale inflation stagnated in February, as a 1 percent decline in trade margins offset rising costs in key sectors, tempering the overall producer price index (PPI), which remained unchanged from January’s revised 0.6 percent gain. Excluding food and energy, PPI declined for the first time since July, though underlying price pressures persisted, particularly in categories tied to the Federal Reserve’s preferred inflation gauge, the personal consumption expenditures (PCE) price index. Hospital inpatient care costs rose 1 percent, portfolio management fees increased 0.5 percent, and core goods prices (excluding food and energy) climbed 0.4 percent—the largest monthly gain in over two years. While declining wholesale margins may temporarily shield consumers from higher import and manufacturing costs, sustained weak consumer confidence and pulled-forward durable goods purchases could weaken demand later this year, potentially forcing retailers to accept thinner profit margins. Tariffs imposed by the Trump administration are also set to exert upward price pressures, with an additional 10 percent levy on Chinese imports introduced in February contributing to notable price gains in iron and steel scrap, machinery, and household goods like furniture and appliances. Meanwhile, food prices surged 1.7 percent, driven by rising egg costs, while energy prices fell 1.2 percent. Despite these mixed inflation signals, a separate report showed jobless claims remained stable, reinforcing the resilience of the labor market.
February price data showed broad-based increases in both manufacturing and services, with multiple regional and national surveys reflecting stronger pricing power across industries. The ISM Manufacturing Prices Index surged to 62.4, its highest level since June 2022, up from 54.9 in January, while ISM Services Prices remained elevated at 62.6. S&P Global’s US Manufacturing sector recorded its fastest output price growth in two years, while US Services firms raised prices modestly, constrained by competitive pressures and weak demand. Regional Federal Reserve surveys further confirmed rising price pressures, with the Kansas City Fed reporting a third consecutive month of price gains in manufacturing, and its non-manufacturing sector also seeing higher selling prices. The New York Fed’s manufacturing prices received index jumped to 19.6 from 9.3, nearly doubling its six-month average, while its services counterpart climbed to 27.4 from 19.4. Similarly, the Philadelphia Fed’s manufacturing index increased to 32.9 from 29.7, while the Dallas Fed’s manufacturing prices received measure rose to 7.8 from 6.2. The Chicago PMI indicated an acceleration in price expansion, and the Richmond Fed’s manufacturing index showed a modest uptick, with prices received rising to 1.62 from 1.21.
While price pressures were broadly higher, select areas saw moderation. The Dallas Fed’s services sector reported a decline in selling prices, falling to 7.9 from 13.7, and the Philadelphia Fed’s non-manufacturing prices received index turned negative, dropping to -1.1 from -0.3. Richmond Fed services prices edged lower to 3.31 from 3.55. Overall, the data suggests persistent inflationary pressures, particularly in goods-producing sectors, with some signs of price relief in services. This supports a mixed inflation outlook, with price growth accelerating in manufacturing and remaining firm in services, despite isolated instances of easing.
Job growth in February 2025 exceeded expectations, with nonfarm payrolls rising by 151,000, led by gains in construction, manufacturing, health care, financial activities, transportation, and social assistance, while declines occurred in leisure and hospitality, retail, and government employment, particularly at the federal level due to a hiring freeze. The average workweek remained steady at 34.1 hours, contributing to a 0.3 percent increase in weekly earnings. However, labor market slack widened, with the unemployment rate (U-3) rising to 4.14 percent, reflecting an increase of 203,000 unemployed individuals. The U-2 rate, which tracks job losses, also climbed, while the broader U-6 measure of underemployment surged to 8.0 percent, indicating a rise in discouraged and involuntarily part-time workers. The labor force participation rate dipped to 62.4 percent as employment declined by 588,000, and transitions out of unemployment slowed, signaling weaker hiring momentum. Aggregate labor income rose 0.4 percent, largely on wage growth, but signs of labor market softening—particularly higher unemployment, an expanding pool of job seekers, and slower re-employment—reinforce expectations for a 75 basis point rate cut by the Federal Reserve in 2025 as economic conditions deteriorate.
US consumer sentiment fell sharply in early March, reaching its lowest level since November 2022, as concerns over tariffs and economic uncertainty weighed on confidence. The University of Michigan’s preliminary sentiment index declined to 57.9 from 64.7 in February, marking a steeper drop than any economist forecasted. Long-term inflation expectations surged by 0.4 percentage point to 3.9 percent, the largest monthly increase since 1993, while one-year inflation expectations rose to 4.9 percent, the highest since 2022. As President Trump’s tariffs expand, consumers across the political spectrum increasingly fear rising costs, with 48 percent of survey respondents mentioning tariffs unprompted, expecting them to drive future inflation higher. Households’ financial expectations hit a record low, and respondents assigned just a 48.7 percent probability to stock market gains over the next year, the weakest reading since May 2023.
Deteriorating confidence presents a growing risk to consumer spending, particularly in big-ticket purchases like homes, vehicles, and discretionary goods. The current conditions gauge fell to 63.5, a six-month low, while the expectations index dropped to its lowest level since July 2022. Political divisions were evident, with confidence among Democrats falling nearly 10 points, independents down 5.4 points, and Republicans slipping nearly 3 points. Economists warn that increased uncertainty over policy shifts and economic conditions is making it difficult for consumers to plan for the future, reinforcing fears that slowing confidence could curb household spending and contribute to economic downside risks in the months ahead.
Small-business optimism declined in February as inflation, policy uncertainty, and concerns over tariffs weighed on sentiment. The NFIB Small Business Optimism Index fell 2.1 points to 100.7, slightly below expectations, with the sharpest declines in economic outlook (-10 points), expected sales (-6 points), and expansion plans (-5 points). While job openings (+3 points), earnings trends (+1 point), and expected credit conditions (+1 point) improved, overall optimism remains well below December’s peak of 105.1, though still higher than the pre-election level of 93.7 in October. Hiring plans softened, with only 15 percent of owners planning to add jobs in the next three months, down 3 points from January, as retail, construction, and manufacturing faced the greatest labor shortages. Just 19 percent of businesses plan to expand in the next six months, reflecting lower expected sales (14 percent, down 6 points) and weak profitability trends (-24 percent). Inflation pressures intensified, with 32 percent of firms raising prices, a 10-point jump and the largest increase since April 2021, though businesses held off on preemptive pricing adjustments ahead of tariffs. Despite tax cuts and deregulation boosting the long-term outlook, high uncertainty is keeping small businesses in a wait-and-see mode, limiting hiring and expansion.
February retail sales fell short of expectations, reinforcing concerns about a slowdown in consumer spending, while weaker manufacturing and homebuilder sentiment further signaled softening economic momentum. Retail sales rose marginally, but seven of the 13 categories declined, including motor vehicles, electronics, apparel, and gasoline, with restaurant and bar sales posting their sharpest drop in a year. January’s figures were revised downward, marking the largest decline since July 2021. While e-commerce activity and healthcare spending lifted control-group sales by 1 percent, economists noted that seasonal adjustments played a significant role, limiting optimism for first-quarter GDP. Weaker income growth and rising job insecurity are likely curbing discretionary spending, particularly among lower-income consumers, while wealthier households may also cut back on major purchases following recent stock market volatility. Business caution is rising as New York state manufacturing activity dropped to its lowest level since early 2024 and homebuilder confidence fell to its weakest reading since August. Mounting uncertainty over tariffs, slowing wage growth, and deteriorating consumer sentiment increase the likelihood of weaker economic expansion, with some analysts warning that first-quarter GDP growth could contract.
US manufacturing activity in February edged closer to stagnation, with orders and employment contracting even as input costs surged. The ISM Manufacturing Index slipped 0.6 points to 50.3, while prices paid for materials jumped 7.5 points to 62.4, the highest since June 2022, signaling renewed inflationary pressures. New orders fell 6.5 points to 48.6, the first contraction since October 2024, and factory employment dropped 2.7 points to 47.6, marking contraction in eight of the past nine months. Rising costs, largely driven by tariff-related supply disruptions, are creating backlogs and inventory imbalances, with businesses struggling to pass on price increases amid softening demand. Imports climbed to 52.6, the highest since March 2024, as firms ramped up orders ahead of Trump administration tariffs on Mexico and Canada set to take effect Tuesday. Meanwhile, headline industrial production surged 0.7 percent, largely due to a 4.3 percent jump in consumer durable goods output, led by a sharp rise in automotive production. Manufacturing production expanded 0.9 percent, while business equipment output rose 1.6 percent, continuing its strong growth since November. Capacity utilization increased to 78.2 percent from 77.7 percent, as factories ramped up activity. The surge in production may reflect firms front-loading output before tariffs disrupt supply chains, suggesting a potential slowdown ahead. However, with Trump administration policies focused on onshoring and boosting domestic manufacturing, industrial activity may continue to receive moderate tailwinds despite near-term volatility.
In February and early March of 2025 the US economy showed mixed conditions. Moderate consumer spending growth, stable vehicle sales, and resilience in financial services were evident but clear signs of strain in manufacturing, construction, and agriculture are becoming clear. Holiday retail sales exceeded expectations, and nonfinancial services, including leisure, hospitality, and transportation, expanded modestly, particularly in air travel. Commercial real estate saw slight gains, and lending activity remained steady with little deterioration in asset quality. However, construction activity declined as high material and financing costs dampened growth, and residential real estate remained stagnant due to elevated mortgage rates. Manufacturing slipped slightly, with firms stockpiling inventories in anticipation of higher tariffs and truck freight volumes fell, signaling weaker goods demand. Rising delinquencies among small businesses and lower-income households raised concerns about financial stability and the overall disposition of consumers. Agricultural conditions remained weak, with low farm incomes and weather disruptions adding pressure.
The huge surge in consumer and business optimism seen in November 2024, driven by disinflationary progress and strong corporate expectations of pro-business policies has steadily eroded in the face of skyrocketing uncertainty. By February and early this month stubborn inflation, weakening employment trends, and clear signs of consumer distress have fueled a sharp reversal in sentiment. Record levels of policy instability—marked by an unprecedented pace of executive orders, shifting tariff threats, and mounting regulatory uncertainty—has further compounded economic unease, disrupting business planning and investment. With the Trump administration’s full slate of tariffs set to take effect on April 2nd, trade flows, input costs, and corporate strategies face the potential for significant upheaval.
With businesses and households increasingly moving to the sidelines amid mounting economic uncertainty, concerns over the likelihood of a recession have risen sharply. Public discourse on the subject has intensified, and while the ultimate outcome remains uncertain, these concerns may not be premature. Given the current policy and economic landscape, strong caution is warranted.